Torque is one of the typical mechanical parameters that need to be detected in the industrial production process. The torque sensor is an important part of the torque test system, which is mainly used to measure various torque, speed and power. Elastomer is the core component of torque sensor, and its structural design parameters are an important factor affecting the sensitivity of torque sensor. Previous researchers have provided a lot of rationale for the design of torque sensors, but have not considered structural optimization of the elastomer itself.
For the elastomer, on the basis of the force analysis, the finite element analysis software ANSYS Workbench is used for static analysis, and the structure of the elastomer is optimized through Design Exploration, which increases the strain of the elastomer and improves the mechanical structure, the sensitivity of the sensor.
1. Force Analysis of Elastomer
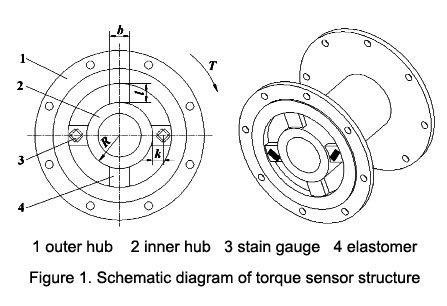
The torque sensor adopts a shear spoke structure, which has the advantages of good linearity, high output sensitivity, resistance to eccentric load and strong lateral force. The 4 elastic bodies are symmetrically distributed between the inner and outer hubs. When subjected to external torque, the elastomer will deform accordingly. Paste the strain gauge in the direction of 45° to the neutral plane of the elastomer to measure The strain proportional to the torque is finally converted into the corresponding voltage signal output through the bridge circuit. Where R is the radius of the inner hub, l is the length of the elastomer, b is the width of the elastomer, k is the distance from the strain gauge to the inner hub, and T is the torque received by the torque sensor.
As shown in Figure 2, in order to facilitate the force analysis, one of the elastic bodies is used as the analysis object. The elastomer of the torque sensor can be regarded as converted from a cantilever beam. Let the external torque be T, imagine that the shear force of the elastomer at the k section is Q, and the bending moment is M(k).

When the external torque is constant, the elastomer strain is determined by the material and the structure size. The selected material should have excellent comprehensive performance and good process performance, and the reasonable structure size of the elastomer becomes the formula: E is Modulus of elasticity, μ is Poisson's ratio and δ is the thickness of the elastomer.

The larger the elastomer strain is, the greater the electrical signal output by the strain gauge will be, and the sensitivity of the torque sensor will be correspondingly improved. The more accurate the measurement is: when the external torque is constant, the elastomer strain is determined by the material and structure size. The selected material should have excellent comprehensive performance and good process performance, and the reasonable structural size of the elastomer will become the main factor determining the sensitivity of the torque sensor.
2. Elastomer Optimized Design
2.1 Optimizing design parameters
The optimal design variables are selected as the width, thickness and length of the elastomer, the maximum strain variable of the elastomer is selected as the optimization objective function, and the constraint condition is selected to satisfy the strength condition of the elastomer, that is, the maximum stress is less than the allowable stress of the material. Therefore, the mathematical model for the optimization of the elastomer structure is as follows:
X=[x1, x2, x3]=[b, δ, l]T
maxF(X)
maxG(X)<[δ0]
Where: F(X) is the strain function of the elastomer; G(X) is the stress function of the elastomer; [σ] is the allowable stress of the elastomer.
The Design Explorer module in ANSYS Workbench software enables rapid optimization of product performance. The general process of optimal design includes: defining optimal design variables and standard variables, sensitivity analysis, output response analysis, optimization analysis and solution verification.
Under the premise of ensuring the bearing capacity of the torque sensor, the elastomer is optimized to increase the strain. The width, thickness and length of the elastomer are selected as the optimization design variables, the initial value is given, the variation range of each structural parameter of the elastomer is set to be ±10% of the initial value, and the maximum stress and maximum strain of the elastomer are used as the target variables. The optimized design parameters are shown in Table 1.
| Optimize design parameters | Initial value (mm) | Upper limit (mm) | lower limit (mm) |
| Width | 21 | 23.1 | 18.9 |
| Thickness | 7 | 7.7 | 6.3 |
| Length | 20 | 22 | 18 |
2.2 Sensitivity analysis of optimization parameters
Through the sensitivity analysis, the influence degree of the design parameters on the system or model can be determined, and the design variables that are actually applied to various iterative methods to achieve the optimization requirements can be obtained, and the parameter sensitivity analysis can be completed. The program analyzes the sensitivity by calculating the measured values of various parameters, so as to determine the degree of influence of the design variables on the target variables, which helps to eliminate design variables that have little influence in the optimization process, narrow the research scope of parameters, and reduce the number of parameters in the optimization process.
Figure 4 is a histogram of sensitivity analysis.

From Figure 4, it can be seen that the influence of three design variables on the maximum strain: the sensitivity coefficient of width is -0.229 31, the sensitivity coefficient of thickness is -0.165 29, and the sensitivity coefficient of length is 0.071 898. The influence of the maximum strain is greater; the influence of 3 design variables on the maximum stress: the sensitivity coefficient of width is -0.229 32, the sensitivity coefficient of thickness is -0.165 18, and the sensitivity coefficient of length is 0.071802. The influence of the maximum stress is greater, and the negative value of the sensitivity coefficient indicates that the design variable is inversely proportional to the target variable. Therefore, in the optimization design, the width and thickness of the structure should be mainly considered, and the influence of the length of the structure should be properly considered.
2.3 Optimization parameter evaluation
Through sensitivity analysis, two design variables with greater influence were extracted from the three optimized design variables, namely the width and thickness of the elastomer. According to the input parameters, ANSYS Workbench will select enough measurement points to combine within each design parameter range to obtain design points. Each design point represents a structural dimension design scheme of an elastomer. After the calculation is completed, each input point is fitted with the output point to form a response surface, so as to determine the region of the optimal solution. Figures 5 are the output response surfaces.
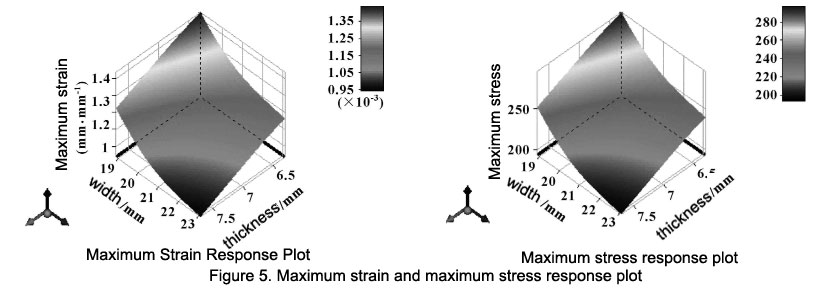
Table 2 shows the three groups of optimization result parameters. The parameter design variable value of group A is relatively small, the obtained strain is the largest, and the maximum stress is also less than the allowable stress. Therefore, the candidate data of the - - group is selected. In order to facilitate processing and manufacturing, the structure size is rounded, and the width of the elastomer is determined to be 19 mm, the thickness is 6.5 mm, and the length is 18 mm. Using this data as a verification, the maximum strain of the elastomer is calculated to be 1.3752x10⁻³, the maximum stress is 283.29 MPa, and the patch position strain in the middle of the elastomer is between 4.848x 10⁻⁴~ 5.056x 10⁻⁴, on average strain is 4. 952x10-4. The stress at the patch position in the middle of the elastomer is between 98.91~105. 69 MPa, and the average stress is 102.3 MPa. Compared with the initial structural design, the maximum strain of the elastomer increases by 11.81%, and the maximum stress increases by about 11.805%, the average strain at the patch position in the middle of the elastomer increases by 9.31%, and the average stress increases by 9.06%.
| Items | A | B | C |
| Width/mm | 18.921 | 19.446 | 22.071 |
| Thickness/mm | 6.307 | 6.9292 | 6.4626 |
| Length/mm | 18.02 | 21.22 | 20.42 |
| Maximum stress | 277.32 | 265.68 | 261.14 |
| Maximum strain | 1.3456 | 1.2896 | 1.2675 |
3. Conclusion
- On the basis of the force analysis of the elastomer, it is verified that the material and structural size of the elastomer have an important influence on the strain variable of the torque sensor when the torque sensor is subjected to the time-time.
- The static analysis of the elastomer was carried out by ANSYS Workbench, and the stress and strain cloud diagrams were obtained.
- Through the sensitivity analysis, it is known that the width and thickness of the elastomer have a great influence on its static characteristics. The optimization analysis function of Design Exploration is used to obtain the reasonable optimized size of the elastomer. Under the condition of satisfying the strength, The strain amount of the elastomer is increased, and the sensitivity of the coupling torque sensor is improved from the aspect of mechanical structure.